COVID-19 Coronavirus Information – Travel, health & safety precautions for MKS employees & partners. Learn More
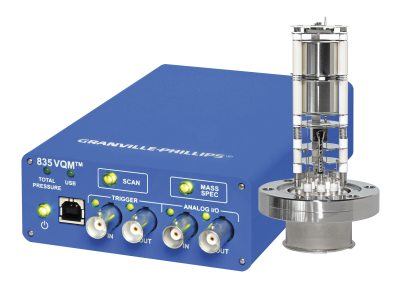
The Granville-Phillips® Series 835 Vacuum Quality Monitor (VQM™) combines the highest performance gas analysis technology with intelligent functional design that transforms complex measurement into actionable information. The 835 VQM is the world's fastest, lowest power mass spectrometer with full data collection, spectral deconvolution, and data logging at 85 ms capture rates for the full 1-145 amu measurement range or 125 ms for 1-300 amu.
Compare | Model | Drawings, CAD & Specs | Availability | Price | |||
---|---|---|---|---|---|---|---|
![]() |
835500-U1-1 Controller, Vacuum Quality Monitor, 1 - 145 amu, 110 VAC | $3,203 |
|
||||
![]() |
835500-U3-1 Controller, Vacuum Quality Monitor, 1 - 300 amu, 110 VAC | $4,017 |
|
||||
![]() |
835100-YG-1D Vacuum Quality Monitor Gauge, 1 - 145 amu, Demountable Envelope | $2,967 |
|
||||
![]() |
835100-YG-3D Vacuum Quality Monitor Gauge, 1 - 300 amu, Demountable Envelope | $3,780 |
|
||||
![]() |
390802-2-YG-T Vacuum Transducer, for 835 VQM, 1x10⁻⁹ Torr to ATM | $2,782 |
|
||||
![]() |
835400 Software Suite, Vacuum Quality Monitor | $594 |
|
Demonstration of the performance characteristics of the MKS Instruments, Granville-Phillips® Vacuum Quality Monitor System (VQM®).
In any vacuum system, it is critical to know the vacuum pressure. In many cases, it can be just as important to know the composition of the gases in the system. The 835 VQM is a mass spectrometer that operates from UHV to 1 x 10⁻⁵ Torr and accurately measures the gases in the vacuum chamber. The VQM system consists of an autoresonant ion trap mass spectrometer gauge, a VQM Controller and VQM Viewer software that converts raw data to actionable information. The system is ratiometric, meaning that it determines the ratio of each gas to other gases in a vacuum chamber. It is usually coupled with a total pressure gauge to provide partial pressures of each gas which provides an indication of the quality of the vacuum in a chamber.
Out-of-the-box you see your 10 most prevalent gases, total pressure trending (with optional total pressure gauge), partial pressure trending, spectral display, data logging, data capture, gas fitting library for 10 gases, and leak check. The Controller and Gauge only requires a maximum of 15 watts to operate and offers the flexibility to remotely mount the 835 VQM Gauge using a cable from 1 to 50 meters long.
Autoresonant ion trap mass spectrometer technology represents an entirely new way of mass selectively ejecting ions from an electrostatic ion trap. The 835 VQM mass spectrometer gauge is natively a ratiometric measurement device that provides detailed compositional analysis of a gas mixture. The ionizer is a filament assembly that generates ions directly inside the ion trap through electron impact ionization. An electrostatic field traps the ions, and they oscillate at their natural frequency within the ion trap. The frequency of oscillation is inversely proportional to the square root of their mass-to-charge ratio. The ions are ejected through an autoresonant energy pumping process using a low amplitude RF scan. An electron multiplier collects the ejected ions and produces a current proportional to the ion concentration.
The filament and electron multiplier are easily replaced by your own service technicians. Replacement kits provide everything needed – including an easy-to-follow instruction guide – to assure quick, simple, and cost effective replacement, as well as maximizing system uptime.
The 835 VQM is typically used for any manufacturing or experimentation process that occurs in a vacuum (glass coating, semiconductor manufacturing, beam line gas analysis, etc.). Primary usage includes system baselining, post chamber PM verification, leak detection, contamination monitoring, process monitoring, and checking the quality of the vacuum in the system.
The 835 VQM Viewer Software Application provides the fastest and easiest way to access the full functionality and optimize the performance of the instrument. The Viewer Application is Windows-based and communicates with the VQM Controller through a USB 2.0 COM port.
Vacuum and system technicians will immediately benefit from the data-mining functions built into the application, including mass peak finding and gas identification. There is no need for an advanced mass spectrometry expert to determine what gases are in your system. Simple, easyto-understand screens instantly display which gases, percentages, ratios, and pressures are present.
Advanced users will find that the full set of adjustments (advanced settings) and data available in the tune screens provide a very convenient way to characterize and optimize the performance of the system.
The Viewer software collects, analyses, and interprets mass spectra. The software averages the mass spectra, finds and quantifies the peaks, and displays that information on the computer monitor. Live displays of scan data show the gases in the vacuum chamber (up to 10 gases/masses), pressures, trends, total pressure, averaging, and the spectrum histogram.
The Tune Screen is used for calibration, electron multiplier gain adjustment, RF amplitude adjustment, and ion trap configuration. The tune screen provides access to the raw spectral output of the mass spectrometer and also to the header information which provides specific information on parameters, status, and hardware. The tune screen also provides access to the factory default and user settings. Advanced mass spectrometry experts can use the tune screen capabilities to customize the instrument for specific operating parameters. An Auto Tune function automatically determines the appropriate settings for optimum system performance.
Gas analysis results are displayed as ratios (normalized), percentages (%), and absolute values (with the optional total pressure gauge). Graphical screen displays show the total pressure, partial pressure, and full spectral data. Partial pressure trend graphs and a leak testing screen allow monitoring specific gas concentrations and partial pressures as a function of time.
Audible alarms and a digital output can be driven by custom equations which monitor the total pressure, partial pressures or preferences. The equations can use Boolean AND and OR functions together with less than, greater than, and equals operators. For the “equals” operation, a tolerance can be provided. The VQI equation can be manually entered or automatically created from a stored spectrum.
The Trend graph on the summary screen shows a 15 minute view of the top 10 gases in the system. The display can use either log or linear scale. A zoom function allows better visibility. There is also an infinite time period trend graph. To fit a longer time scale on the graph and keep the data storage size reasonable, the trend screen will drop intermediate data points as needed.